The Internet world is drowning in information — literally. In 2012, there were 2 million search queries per minute. Today, that number has doubled to more than 4 million. Every second of the day, ordinary users create a mind-boggling amount of data. DOMO, for example, found that every minute:
- Twitter users create 300,000 tweets.
- Facebook users share 2.5 million pieces of content.
- YouTube users upload 72 hours' worth of content.
- Instagram users upload 220,000 new images.
- Email users send more than 200 million messages.
Infographics, like other data visualizations, are popular for their uncanny ability to distill large amounts of information and present it in a visually appealing, easily digestible format. To help you stand out in the midst of a crowded and noisy Web, we’ve compiled a list of steps to follow to create highly shareable infographics that have the potential to go viral--and, in the process, get your name known.
1. Review and process information
The key to a compelling infographic is finding information that is not only accurate but also revealing and informative. Use only trustworthy sources in the information-gathering process and cite them at the end of your infographic. Also, make sure your information is compelling, provocative, and even a bit controversial to engage readers.
2. Determine the objective of your infographic
Once you have the information you need, determine exactly what you want to achieve with your infographic and who you want to target. Having a clear image of your target audience — what their concerns are and what they want to hear — is crucial to creating an effective infographic that will mobilize your viewers and prompt them to take a specific action. Whether your objective is to inform your audience of a specific issue, to generate more site traffic or to create greater awareness of your brand, your stated objective will drive the rest of the infographic creation process.
3. Tell a compelling story
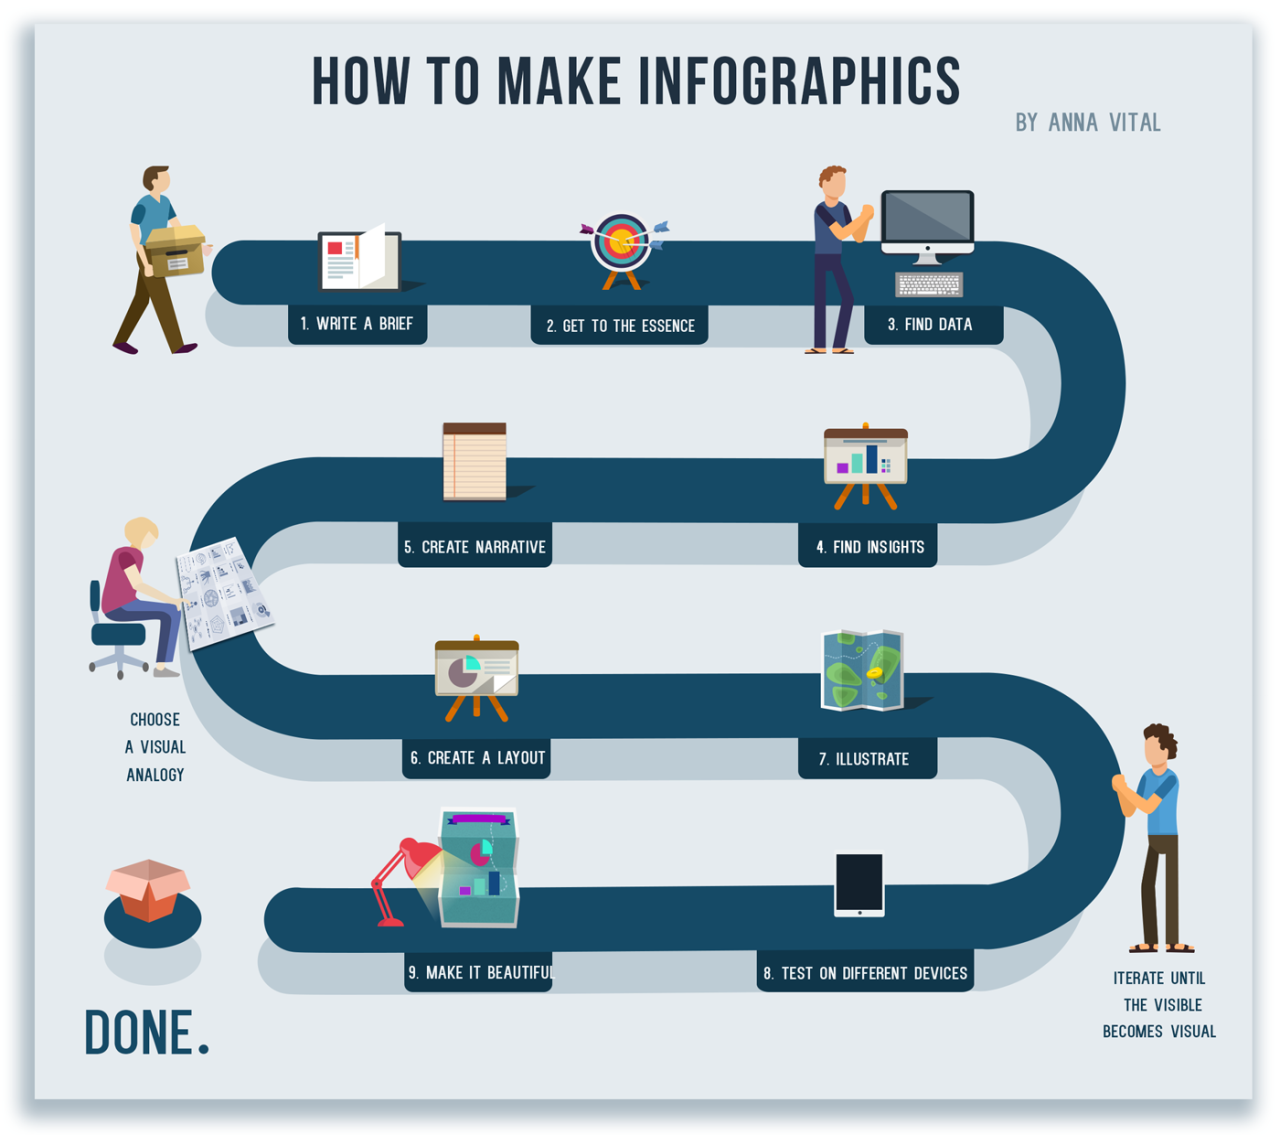
You might have an incredible amount of vital information to share, but if your infographic doesn’t tell a good story, it will most likely fall flat. Marketers, academics and the world’s best presenters know that storytelling is the key to crafting a memorable message that will stick in viewers’ minds for years to come. Having a well-crafted storyline with a conflict, a rising climax and a resolution is crucial not only to the success of a traditional text-based story but also a visual one in the form of an infographic, as seen in the example above.
4. Choose a type of infographic
There are many types of infographics, so choose wisely. As seen in the infographic above, you can choose from a visualized article, a flowchart, a timeline, a how-to guide, a comparison of two things, a photo infographic, a mixed-charts infographic, or a data visualization.
5. Determine how to present information
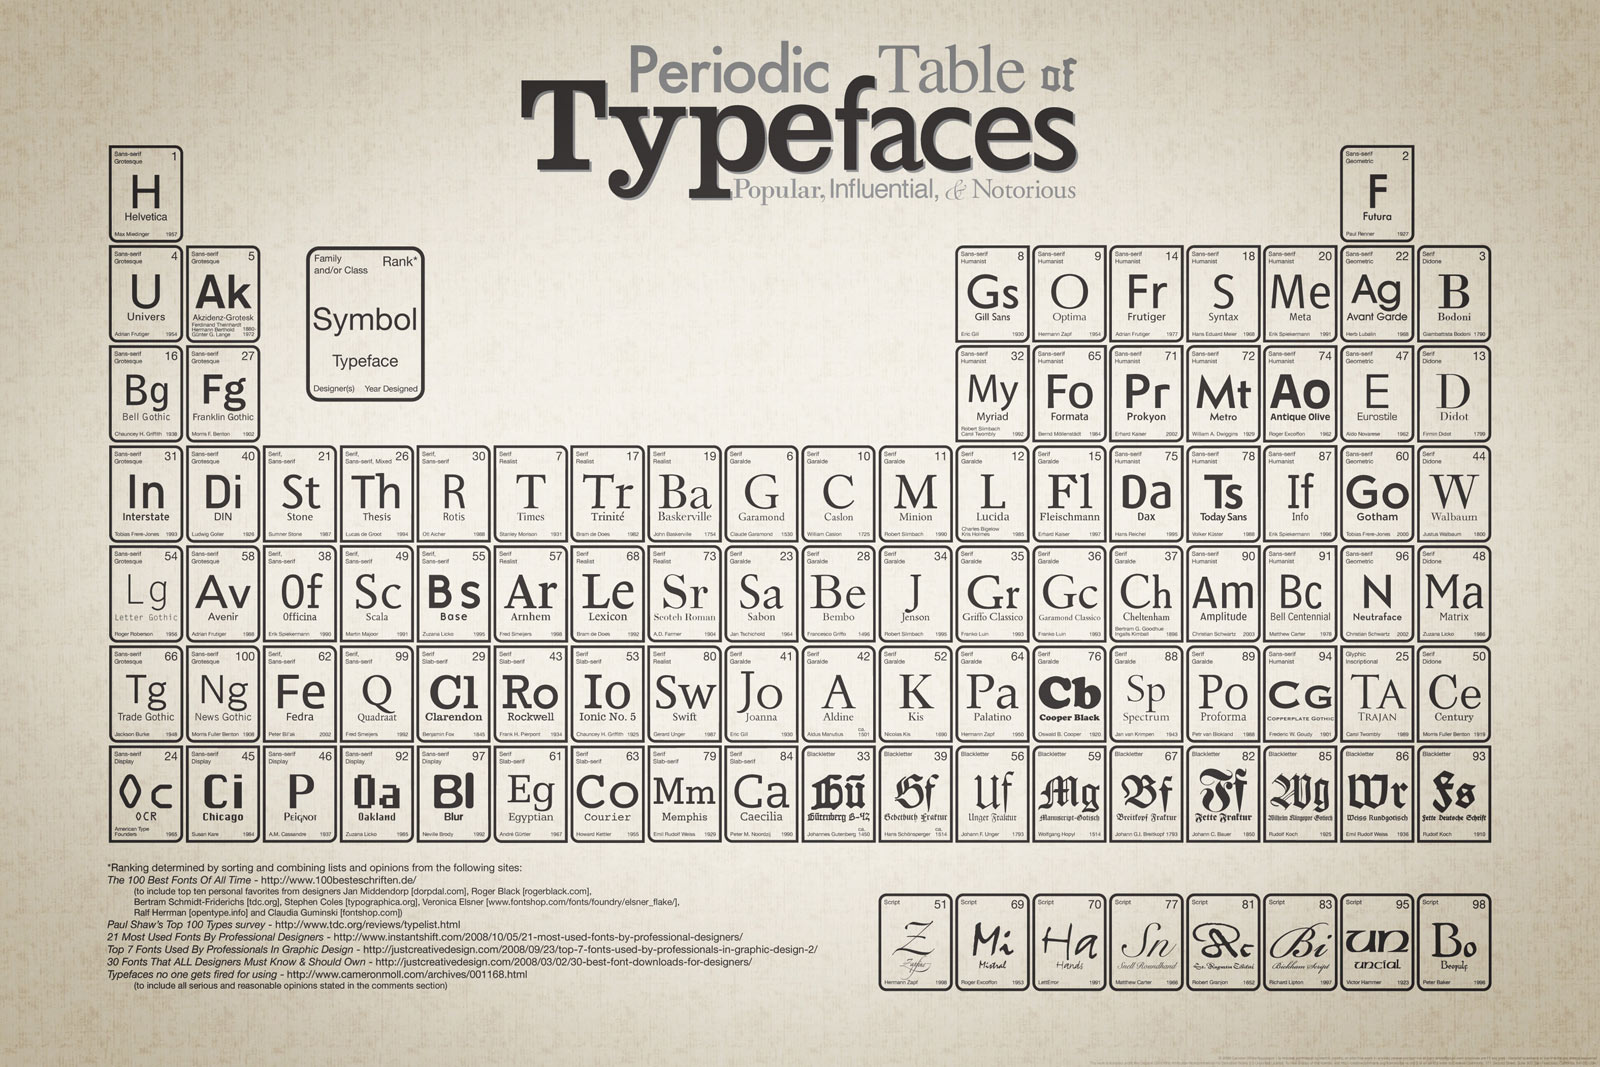
Besides deciding on the type of infographic you will use, you can also further define what it will look like by determining its visual approach. Either you can choose to present data with straightforward graphs and charts or you can choose to be a bit more creative and define an overarching theme or metaphor. For example, the above infographic does a nice job of organizing font types by borrowing the periodic table's structure.
6. Design the layout
The designer can now create a wireframe for your infographic. As shown in the image above, this entails laying out the information and basic design elements. This mockup gives all those involved in the infographic creation process a clearer idea of what the piece will look like, enabling them to suggest changes. At the same time, details such as font combinations and colors are left for the subsequent phases. This is the part where you ensure that the infographic has a clear hierarchy and a healthy dose of negative space. Once you have explored the different options and decided on the best layout, you can go on to the next step.
7. Illustrate
Now comes the part where designers can tap into their creative powers to create a visually appealing, easily consumable infographic that can convey several pages of information in a single glance. This is where colors, font combinations and other visual details are determined and refined.
8. Review and modify
This step is crucial to finding unnoticed errors and correcting them. To avoid costly mistakes, get as many eyes on your infographic as possible and make the necessary changes.
9. Make it shareable
To ensure your infographic has a long and healthy lifespan, make it shareable by providing a code users can copy and paste to embed it on their own blogs or sites. Also, include prominent, easy-to-find social sharing buttons on the page hosting your infographic.
10. Roll out a drip campaign
To get the most out of your infographic, create a drip campaign on all your major social media networks. Instead of simply posting a link to your infographic, share one specific fact or figure from it to entice readers to read the rest. This can be done over several days, depending on the number of facts you have and the platform you're using. On Twitter, for example, facts can be shared multiple times in a single day. On Facebook, however, sharing no more than one fact per day is advisable.
Creating an original infographic from scratch can take several days, even weeks, depending on its complexity and length. For those needing shorter processing times for infographic creation, another viable alternative is using free infographic creation software such as Visme. It enables you to either create a fully customizable infographic or choose from dozens of professional-looking templates. It also offers thousands of free vector assets and graphing tools that let you easily create infographics in a matter of hours, rather than days or weeks.

![30 Free Stock Image Sites To Download Photos in 2026 [Updated]](https://storage.ghost.io/c/c0/f5/c0f5a5c9-a064-4d18-92d9-da80f23651ff/content/images/size/w1304/format/webp/2026/01/Free-Stock-Image-Sites-min.jpg)